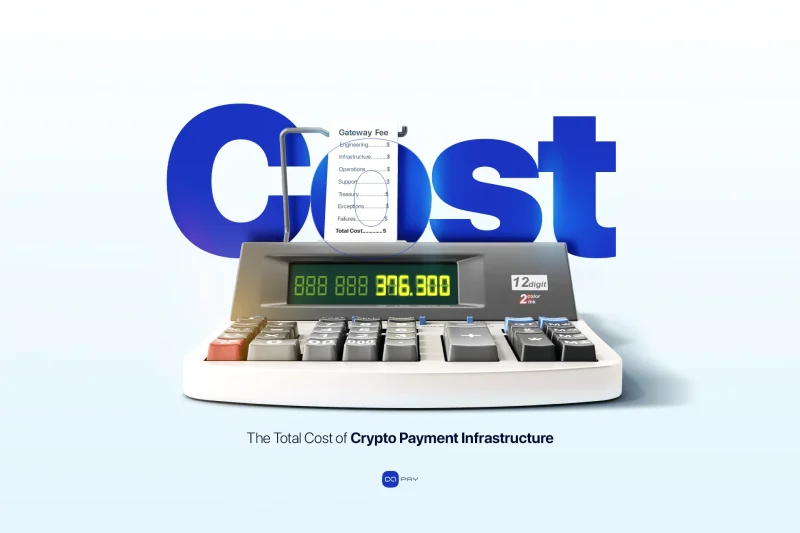
A crypto payment provider may advertise a transaction fee of one or two percent. That rate matters, but it does not show the full crypto payment infrastructure cost.
Businesses also spend money on integration, infrastructure, monitoring, support, treasury activity, reconciliation, security, maintenance, and payment failures. Invoices show some of these costs, while engineering hours, support tickets, manual reviews, and delayed orders reveal others.
Businesses should therefore evaluate crypto payments through total cost of ownership (TCO) rather than compare provider fees alone.
The useful question is: “How much does it cost us to process a successful crypto payment from checkout to a completed business outcome?”
What Does Crypto Payment TCO Measure?
The full crypto payment infrastructure cost includes the resources required to launch, operate, maintain, and scale a crypto payment system. A practical model is:
Crypto Payment TCO = Direct Payment Costs + Implementation Costs + Ongoing Technology Costs + Human Operating Costs + Treasury Costs + Exception Costs + Failure Costs
Not every business will incur every cost, but the costs that do exist should be measured together. A low gateway fee can still be expensive if it creates substantial engineering or manual work.
| Cost Layer | What It Includes |
|---|---|
| Direct payment costs | Provider fees, fixed service fees, external blockchain transfers |
| Implementation costs | Initial integration, testing, deployment, and setup work allocated across the analysis horizon |
| Ongoing technology costs | Hosting, databases, event processing, monitoring, security controls, backups, and maintenance |
| Human operating costs | Support, payment review, reconciliation, operational handling, and engineering attention |
| Treasury costs | Conversion, fund movement, balance management, and related operational work |
| Exception costs | Manual review and handling for payments that require intervention but may still reach the correct outcome |
| Failure costs | Economic loss and recovery work when the payment flow does not produce the intended business outcome |
Start with the Cost of a Successful Payment
Provider pricing is often expressed as a percentage of volume, but that alone cannot show the total cost of crypto payments. To compare complete payment systems, businesses need a metric that includes both provider charges and the internal cost of producing successful payment outcomes.
Cost per successful payment = Total payment-system cost ÷ Successfully completed payments
A successful payment is one that reaches the intended completed business outcome, not merely a transaction detected on-chain. If a business spends $4,000 per month across provider charges, infrastructure, Engineering, Support, Finance, and payment operations, and completes 2,000 successful payments:
$4,000 ÷ 2,000 = $2 per successful payment
That figure reflects the full cost of producing a usable payment outcome.
A second useful metric is:
Effective payment cost rate = Total payment-system cost ÷ Successfully processed payment volume
If successfully processed monthly payment volume is $200,000 and the complete system costs $4,000:
$4,000 ÷ $200,000 = 2% effective cost
The provider may charge less than 2%; the difference represents the rest of the payment infrastructure.
The 7 Cost Layers of Crypto Payment Infrastructure
Layer 1: Direct Payment Costs
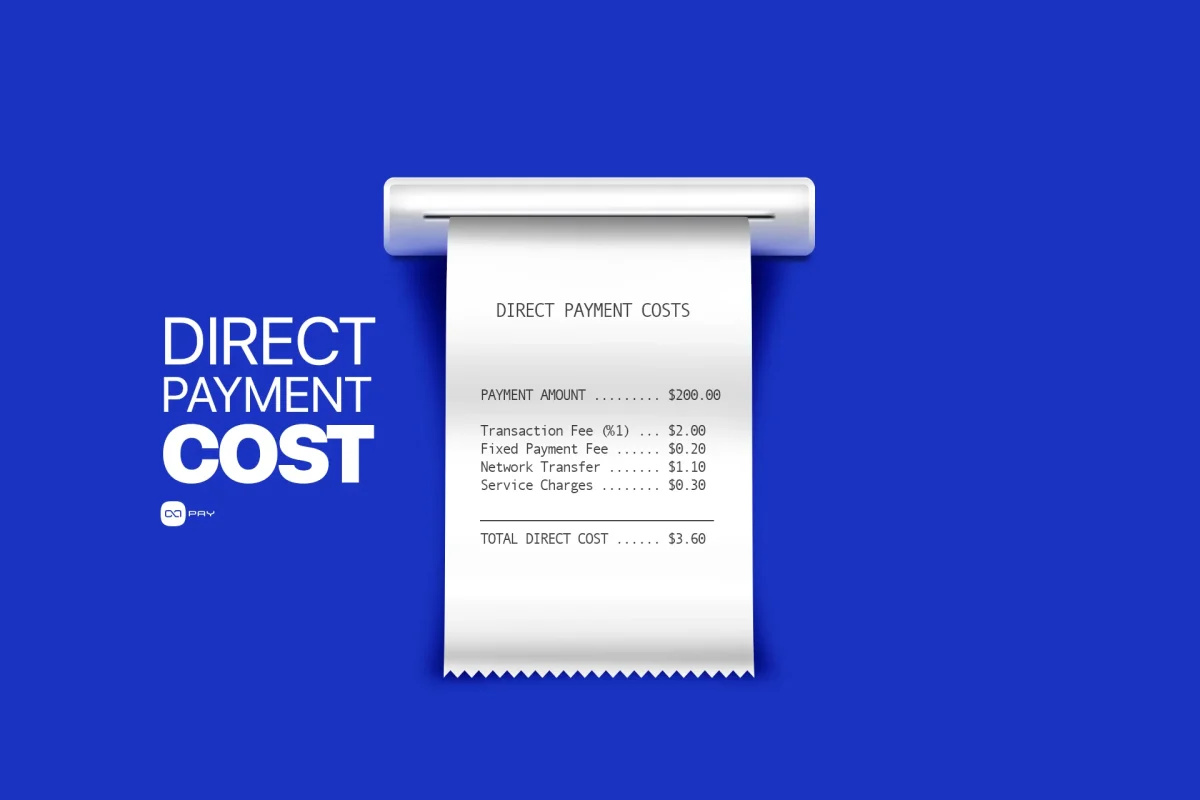
Direct costs are usually the easiest part of TCO to identify. They include transaction fees, fixed service fees, external blockchain transfer costs, and other service-specific charges.
These costs should still be evaluated against payment size and volume. A percentage fee affects a $20 payment differently from a $2,000 payment, while a fixed network charge can materially change the economics of smaller transactions.
Track both direct cost per payment and direct cost as a percentage of payment volume. OxaPay’s current pricing page or Fee Calculator can provide the direct-cost starting point, but not the complete TCO. For comparison across months or providers, keep the same denominator and transaction scope so changes in average order value do not distort the result.
Layer 2: Implementation Cost
Implementation cost depends on how much payment infrastructure the business must create itself. A Payment Link, plugin, API integration, White Label flow, and custom payment system require very different levels of engineering responsibility.
More control can require backend integration, payment-to-order mapping, status handling, webhooks, customer-facing states, testing, logging, monitoring, deployment, and maintenance.
Custom integration is not inherently inefficient. At sufficient scale, specialized logic may reduce recurring operational work, improve control over checkout and order handling, or support requirements that simpler integrations cannot. The mistake is comparing provider fees while ignoring the engineering cost required to build and keep that control reliable.
For TCO analysis, spread the initial build cost across a defined analysis horizon. If an integration costs $24,000 and is evaluated across 24 months:
Monthly implementation cost for TCO analysis = $24,000 ÷ 24 = $1,000
Including that amount prevents a customized system from appearing artificially cheap after launch.
Layer 3: Ongoing Technology Cost
Launch is not the end of payment engineering. API-based and custom flows may require hosting, databases, event processing, logging, monitoring, security controls, backups, testing environments, and maintenance.
The cloud bill may be modest, while ongoing engineering attention is not. Every new asset, network, workflow, status rule, or dependency adds something that must remain tested and observable.
This is a complexity cost. Additional payment options are valuable only when the business value they create justifies the operational burden they add. A new network, status rule, or dependency may improve customer choice, but it also expands the combinations that teams must test, monitor, support, and recover when something goes wrong.
Layer 4: Human Operating Cost
Human operating cost is easy to miss because it appears on employee calendars rather than provider invoices. Support, Finance, Operations, and Engineering may spend time investigating exceptions, answering status questions, locating records, correcting order states, preparing financial records, and escalating technical cases.
Treat this work as a real cost:
Monthly payment labor cost = Payment-related staff hours × Loaded hourly cost
If those teams collectively spend 80 hours per month on crypto-payment work at an average loaded cost of $40 per hour:
80 × $40 = $3,200 per month
Two systems with similar gateway fees can therefore have very different economics. For TCO, the key question is: how many human hours does the payment system consume? This is why recurring labor should be measured alongside provider charges rather than treated as overhead that sits outside the payment model.
Layer 5: Treasury and Fund-Movement Cost
Receiving a crypto payment does not necessarily end the financial workflow. A business may keep the asset, convert it, consolidate balances, move funds, or use them for payouts. Each choice can add fees and operational work.
Treasury cost = Conversion costs + External transfer costs + Internal management effort
OxaPay tools such as Auto Convert and Auto Withdrawal can be evaluated within this layer. Their value should be measured by their effect on the complete workflow, including manual treasury work, asset exposure, balance management, and external transfers. An automated action may reduce staff effort while increasing another cost, so the net effect matters more than the fee attached to one individual step.
The right configuration depends on the business; TCO provides the framework for measuring the result.
Layer 6: The Cost of Exceptions
Exceptions require review or manual handling but may still reach the correct business outcome. Their cost often appears as staff time rather than a provider charge.
Examples include underpayments, late payments, unresolved states, incorrect customer actions, order-state issues, and refund-related review.
For TCO, the question is simply: how expensive are exceptions?
Monthly exception cost = Number of payment exceptions × Average handling cost
If a business has 100 exceptions per month and each consumes 15 minutes of staff time, that equals 25 hours. At $40 per hour:
25 × $40 = $1,000 per month
A useful KPI is exception cost per 1,000 payments. Tracking it shows whether the payment system is becoming easier or harder to operate.
Layer 7: Failure and Revenue Leakage
Failure cost begins when the payment flow does not produce the intended business outcome and creates economic loss or recovery work. This can include abandoned purchases, paid orders that are not fulfilled, duplicated actions, unnecessary refunds, emergency engineering work, support escalation, or delayed access.
Suppose a payment-system issue causes 20 customers to abandon $100 orders:
Lost gross sales = 20 × $100 = $2,000
That $2,000 is a revenue-leakage indicator, not automatically $2,000 of TCO. Estimate measurable economic impact using lost gross or contribution margin, support and engineering work, recovery actions, and remediation costs.
Long-term customer loss should be tracked separately unless historical data supports a conservative estimate. When indirect impacts cannot be measured precisely, use clearly defined assumptions rather than treating them as zero. Keeping revenue leakage separate from direct recovery cost also reduces the risk of double counting the same incident in multiple TCO categories.
The TCO Worksheet
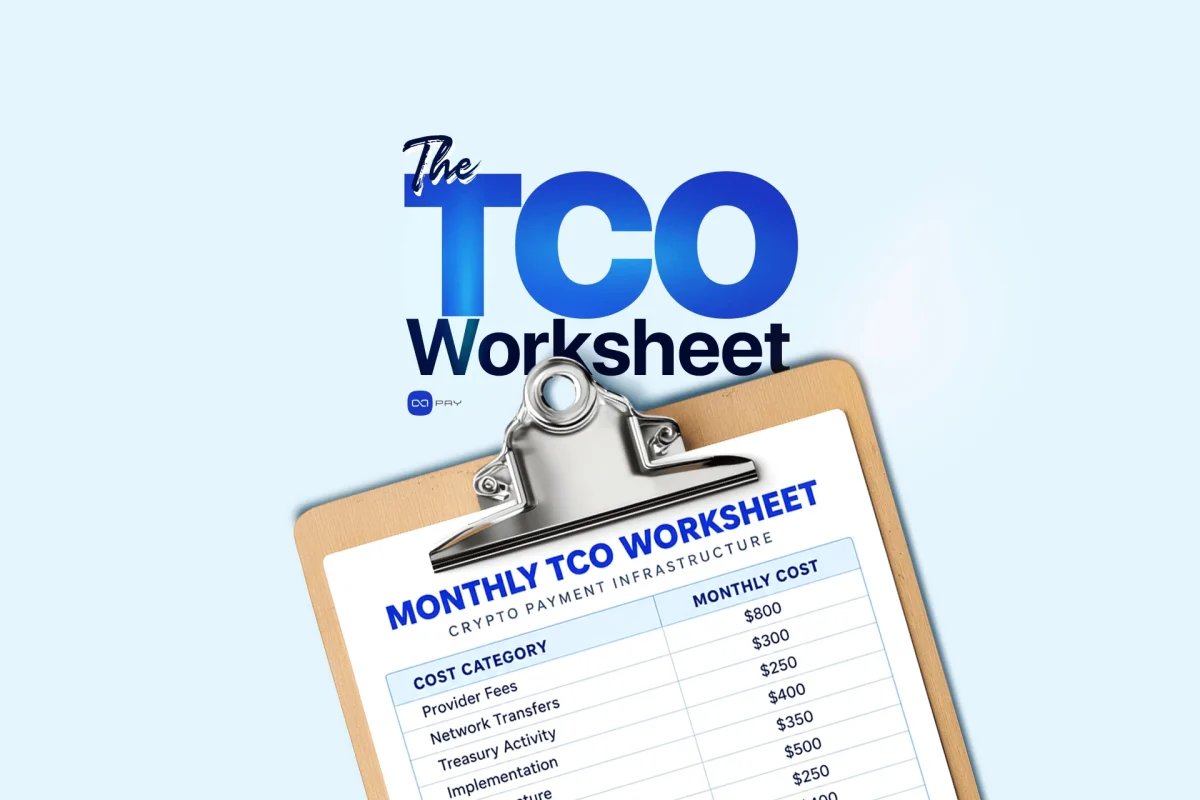
To measure crypto payment infrastructure cost consistently, review these categories with one monthly worksheet. Add successful payment count and successfully processed payment volume, then calculate cost per successful payment and effective payment cost rate.
| Cost Category | Monthly Cost |
|---|---|
| Provider and service fees | $___ |
| External network transfers | $___ |
| Implementation cost allocated to the analysis period | $___ |
| Hosting and technical infrastructure | $___ |
| Engineering maintenance | $___ |
| Security and monitoring | $___ |
| Support and customer payment handling | $___ |
| Operations and payment review | $___ |
| Finance and reconciliation | $___ |
| Conversion and treasury activity | $___ |
| Exception handling | $___ |
| Failure cost and measurable revenue leakage | $___ |
| Total Payment TCO | $___ |
Compare Payment Architectures, Not Just Providers
Comparing the full crypto payment infrastructure cost becomes especially useful when two payment architectures have different visible and hidden costs.
For example, System A may have a lower transaction rate but require custom integration, several internal services, engineering maintenance, and frequent manual investigation. System B may have a higher visible provider cost but use managed infrastructure, fewer internal components, and fewer staff hours. Neither architecture is automatically cheaper; the economics depend on payment volume, operational workload, and how much internal capability the business already has.
Looking only at the gateway rate makes System A appear cheaper. After Engineering and Operations are included, System B may have the lower cost per successful payment.
The opposite can also happen: at sufficient scale, a business with strong engineering capabilities may justify more internal infrastructure because fixed investment is spread across greater payment volume.
TCO does not favor one architecture by default. It identifies the point at which one becomes economically more efficient than another.
Where OxaPay Can Affect TCO
OxaPay can affect several TCO layers because merchants can choose different integration models rather than building the same architecture for every use case.
Options include Payment Links, ecommerce plugins, Merchant Invoice APIs, White Label payments, and Static Addresses. The TCO principle is simple: use only as much infrastructure as the business actually requires.
A small merchant may not need a custom backend, while a platform with complex order logic may need an API. OxaPay also provides Webhooks, Payment Information, Payment History, Auto Convert, Auto Withdrawal, and payout tools. These capabilities can affect different TCO layers by changing how much custom code, monitoring, reconciliation, treasury handling, and manual investigation the merchant must operate internally.
Do not count these capabilities as automatic “savings.” Measure whether they reduce custom development, external tooling, manual handling, treasury work, support investigation, or maintenance.
How to Reduce Crypto Payment TCO
The strongest improvements often come from reducing unnecessary complexity rather than negotiating a few basis points from one fee. Focus on four areas:
Match the integration to the business
Do not build a complex API system when a plugin or Payment Link solves the requirement, and do not keep high-volume work manual when automation would reduce recurring labor.
Measure manual work
Track the payment-related time spent by Support, Operations, Finance, and Engineering.
Track exceptions separately
A system can process many payments successfully and still be expensive if it creates substantial manual review.
Review TCO after meaningful changes in volume, average payment size, networks, integration complexity, provider pricing, or automation
Payment economics should be recalculated as the business changes.
What Comes Next?
The cheapest crypto payment system is not necessarily the one with the lowest transaction fee. It is the system that produces the required payment outcome at the lowest effective cost without sacrificing reliability, security, or operational control.
A complete model includes direct fees, implementation, ongoing technology, human operations, treasury, exceptions, and failures. Convert that total into cost per successful payment and an effective payment cost rate based on successfully processed volume.
OxaPay’s public pricing and Fee Calculator can provide the direct-cost starting point. The remaining inputs come from the merchant’s Engineering, Operations, Support, Finance, and payment-performance data.
Once those numbers are combined, crypto payment infrastructure cost becomes something the business can measure, compare, and improve.